Equality, Diversity and Inclusion at Curve
At the heart of what we do are our people. We are committed to creating an environment of positive working relationships.
Everyone who works with, and for Curve should therefore be treated with dignity. This means:
- A workplace free from bullying, harassment or victimisation
- Be treated with dignity, respect and courtesy
- Experience no form of discrimination or aggressive behaviour
- Be valued for their skills and abilities
- Be appointed and developed on the basis of merit
Any behaviour that contradicts the above will not be tolerated and will be dealt with immediately.
Everyone at Curve has the responsibility to ensure no one working for our theatre is a victim of such behaviour.
We encourage everyone to report any experiences of unacceptable behaviour to another colleague, your line manager, HR or member of the Senior Management Team.
Representation at Curve
We celebrate the diversity of the work on our stages and we continue to work hard to find ways of ensuring our workforce is more reflective of the city in which we serve. Below is the 2023/24 data regarding representation at Curve.
Our Workforce identify as follows:
Ethnicity
83% White British
6% Asian
0% Mixed Background
4% Black/ Black British
1% Any other ethnic group
Sexual Orientation
10% Bisexual
6% Gay man
1% Gay woman/Lesbian
3% Queer
Disability
17% identify as being either D/deaf and or disabled or have a long term health condition
13% identify as neurodiverse
Gender Identity
44% Male
53% Female
2% non-binary
Our leadership team
Ethnicity
100% White British
Sexual Orientation
38% LGBTQ+
Disability
38% identify as being either D/deaf and or disabled or have a long term health condition
Gender Identity
50% Male
50% Female
Socio-economic background of our Leadership Team:
25% highest income earner at age 14 was routine manual and service
25% highest income earner at age 14 was senior management
38% highest income earner at age 14 was modern professional
12.5% highest income earner at age 14 was technical and craft occupation
Our Board of Trustees:
Ethnicity
50% White British
26% Asian Indian
8% White Other
8% Mixed White and Black Caribbean
8% Mixed other
Sexual Orientation
8% LGBTQ+
Disability
0% identify as being either D/deaf or disabled, or having a long term health condition
Gender Identity
42% Male
50% Female
8% Prefer not to say
Socio-economic background of our Leadership Team:
8% highest income earner at age 14 was routine manual and service
17% highest income earner at age 14 was middle and junior management
42% highest income earner at age 14 was modern professional
8% highest income earner at age 14 was semi-routine manual
8% highest income earner at age 14 was traditional professional
8% highest income earner at age 14 was technical and craft occupation
Our Actors in our 23/24 Made at Curve produced work identify as follows:
Ethnicity
45% White British
5% Black African/Caribbean
4% Asian Indian/British
2% Any other Asian background
2% Any other Mixed background
4% Any other White background
3% White and Asian
5% White and Black African/Caribbean
Sexual Orientation
20% LGBTQ+
Disability
5% identify as being either Deaf or disabled, or having a long-term health condition
Gender Identity
40% Male
25% Female
Commissions
Over the last two years* we have presented or are to be presented five Made at Curve commissions/ co-commissions on our stages;
The Owl Who Came for Christmas
Scenes From Rent: A Staged Performance
Finding Home
Fantastic Foxes
Pirates Love Underpants
All 5 of these commissions were created/co-created by artists underrepresented in our industry and on our stages.
*Commissions under the current leadership of Curve.
Voices for Change
Curve is committed to a set of Equality, Diversity and Inclusion principles which include taking actions to both promote equality for all staff and those that engage with the theatre and embed strong values within the organisational culture.
As part of this, an Equality, Diversity Inclusion Group ‘Voices for Change‘ has been formed of Trustees, employees, partners, artists and friends/associates of Curve. Equality, Diversity and Inclusion covers all forms of diversity including but not limited to: age, disability, gender reassignment, marriage and civil partnership, pregnancy and maternity, race, religion or belief, sex, sexual orientation, socio-economic background.
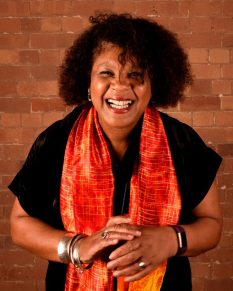
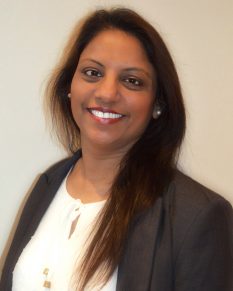
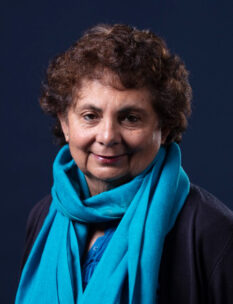
Below are our ‘Voices for Change’ group members.

Ali Sinclair

Nicola Allen

Pawlet Brooks FRSA

Rob Green
Shilpa Mistry

Chris Stafford

Smita Vadnerkar

Rob Ward

Vijay Sharma

Zainab Rao
Tamika Gore
Jasdeep Singh
Amber Willmott
Gender Pay Gap Report
What is the Gender Pay Gap?
The Gender Pay Gap (GPG) shows the difference in the average pay between men and women. As employer must comply with the regulations for any year where they have a ‘headcount’ of 250 or more employees on the ‘snapshot date’ (5 April 2020).
Definition of employee
For the purposes of the GPG report, the definition of who counts as an employee is defined in the Equality Act 2010. This is known as the ‘extended’ definition which includes:
- Employees
- Worker and agency workers
- Some self-employed people
Full-pay relevant roles
To be included as a full-pay relevant employee, the employee must be paid their full usual pay during the period in which the snapshot date falls. If the employee is paid less than their usual rate because of being on leave for that period, they should not be counted as a full-pay relevant employee.
Calculations
As we don’t make bonus payments, we are required to report on three calculations:
- Mean gender pay gap in hourly pay. A mean average involves adding up all of the numbers and dividing the result by how many numbers were in the list.
- Median gender pay gap in hourly pay. A median average involves listing all the numbers in numerical order. If there is an odd number of results, the median average is the middle number. If there is an even number of results, the median will be the mean of the two central numbers.
- Proportion of males and females in each pay quartile. This calculation requires an employer to show the proportions of male and female full-time relevant employees in four quartile pay bands, which is done by dividing the workforce into four equal parts.
Gender Pay Gap
Full-pay relevant employees on the snapshot date of 5 April 2020 was 47 males and 50 females.
| 2019 | 2020 | |
| Median | 6% | 14.5% |
| Mean | 9.3% | 10% |
Full-pay relevant employees
Males – 48%
Females – 52%
Office of National Statistics figures state the national mean pay gap for the whole economy is 15.5% in 2020.
Quartiles
Upper Quartile:
Males – 54%
Females – 46%
Upper Middle Quartile:
Males – 50%
Females – 50%
Lower Middle Quartile:
Males – 42%
Females – 58%
Lower Quartile:
Males – 44%
Females – 56%
Summary Context
- The quartiles have been split as evenly as possible with 24 full-pay relevant employees in each quartile except the lower middle quartile that has 25 full-pay relevant employees.
- The pattern that can been seen across the UK economy is reflected in the make-up of Leicester Theatre Trusts’ workforce, where the majority of front-line roles are women and the make-up of our technical and facilities teams are mostly men. There have been improvements in the gap between men and women in the lower quartile since 2019, however we are continually seeking ways to improve this across the organisation.
- Whilst unremunerated and not captured as part of the Gender Pay Gap report, it is important to note that of our 14 Board of Trustees 9 are female (64%).
Next Steps
- Continue to work to attract and develop women into non-traditional roles within theatre, such as technical through apprenticeships and CYCC technical;
- Continue to embed revised recruitment process and practice including diversity on interview panels and evolvement of less formal interview practices;
- Review flexible working practices where possible to encourage a healthy work/life balance;
- Develop our management team across the organisation to support the development of talent within their teams;
- Utilise our Creative Career Pathways initiative to raise awareness of the different career opportunities available within Curve (and the Arts);
- Continually monitor and review best practice across the industry to improve the Gender Pay Gap within theatre, looking at ways to work on initiatives with other industry exemplars;
- Continue to ensure all posts are benchmarked against industry standard.
Signed,
Chris Stafford, Chief Executive and Nikolai Foster, Artistic Director